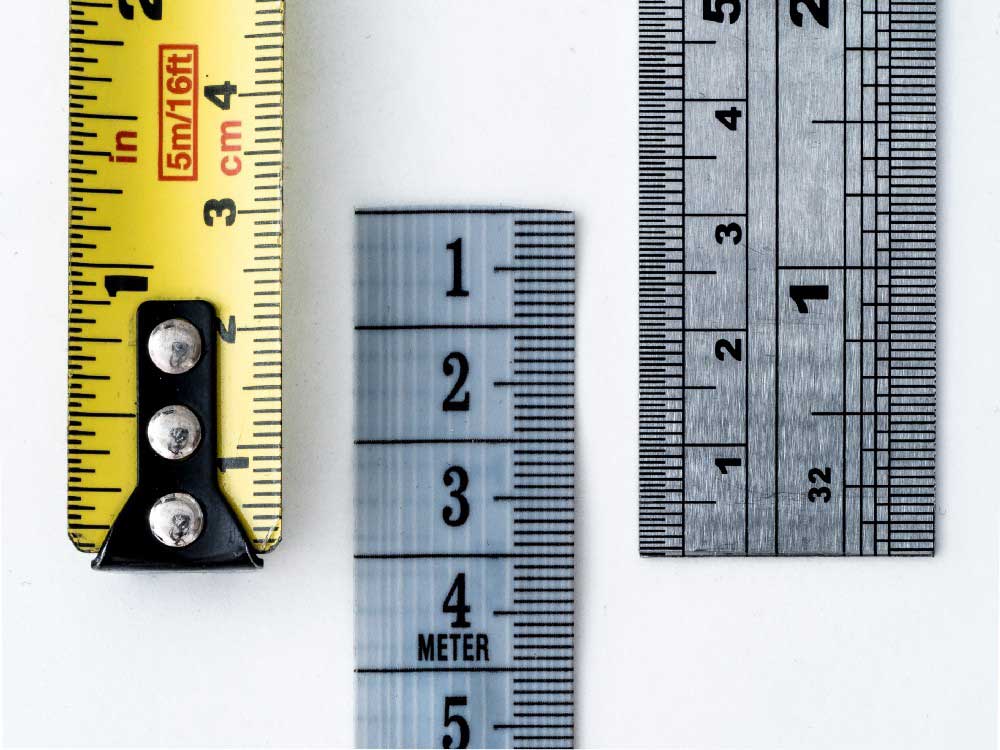
The result for companies (at least in many cases) is that in order to measure the environmental stress in a department, for example, they will build “homemade” tools, without suspecting in the least that metrology (sociometry, psychometry) is a science in its own right. They may also use tests that have been presented to them as being reliable; however, without a scientific validation article reviewed by experts, a test may be reliable, or it may not be, there is no way to be sure, which is quite a risk! In both cases, it is almost like trying to measure the length of a table with a thermometer, the example may seem a bit over the top, but it actually is not that far off the mark… Why?

The first two steps of Churchill’s method consist of interviewing several populations concerned by the criterion to be evaluated (social representations, behaviors, opinions, motivations, values, etc.). First and foremost, a population of experts on the subject, but then also people likely to be concerned in some way – the aforementioned average Joe and Jane. These interviews allow for a “rupture”; in other words, they allow researchers to break with their prejudices. It is a human flaw (a cognitive bias) to believe that we know how the majority of people think, we categorize… and without having collected as many opinions as possible, we can miss what is most important, or get our priorities wrong. These interviews also allow us to identify the vocabulary used by these average Joes and Janes. You will agree that the statement “at the moment, anhedonia characterizes me” means the same thing as “at the moment, I don’t feel like anything”, but the first formulation may not be understood by everyone; therefore, it may lead to erroneous answers (“Oh, I thought it meant […]”) or to an avoidance of the question entirely due to not understanding it. Once the verbatim (faithful transcription of the interviews) has been compiled, a content analysis is used to generate what is called the “item pool”; i.e., a list of assertions which is then proposed in the form of a questionnaire (after checking the context effects for the order of the items and managing potential biases in the responses as best as possible).
The following stages of Churchill’s method allow the tool to be refined, to eliminate complex items for example; i.e., those which were not always interpreted in the same way by all the respondents, or those which in the end do not provide much information necessary for understanding the problem. We also check the validities (there are several) and the reliability of the tool.
It is only after all these steps that we begin to identify thresholds or norms… This is why it takes so long to build a valid tool, but this is also why it is a valid tool, one could also say “a tool that minimizes error.” The less valid a tool is, the more likely it is that the scores it produces will be false (from a slight tendency to a clearly false result); and therefore the more likely it is that decisions will be made on a totally random basis… In fact, in this context, using the scores collected for an important decision is about the same as flipping a coin; except that anyone who does not know the first thing about measure theory will have had the impression that they were making a considered decision.
The idea is simple and effective: ask the future respondents to design the questionnaire themselves. Thus, on one or more themes, defined by a word or an expression (e.g., to know what individuals are interested in, the words will be “death”, “love”, “the environment”, etc.), each person gives one or more statements and justifies them. People can add their own theme(s), the goal being to collect as many opinions as possible and as many verbatims (vocabulary) as possible while leaving as much freedom of expression as possible.
The file is then analyzed using Q methodology[5], which allows us to identify the main themes and a first factorial analysis allows us to categorize them. Then, a work of experts will recover the information, thus the sentences and expressions of the individuals to gather them in the form of questionnaire(s).
All that remains is to choose the scale (Likert, VAS, etc. depending on the need for precision), to check the order of the items, and to submit the whole to a sample of people (remember the rule: 10 people minimum per item; thus for a questionnaire of 20 items, a sample of at least 200 people will be needed); then, once the questionnaire has been refined, resubmit it to a larger sample in order to study the validities and reliability, and then to identify the norms and/or thresholds.
For the example of our survey on the subjects of attention, a study which could have been satisfied with being a simple survey intended to know what the attention of French people was focused on in the middle of an unprecedented health crisis, we obtained 640 responses for the first stage and 4725 for the second.
If we had chosen the polling method, our results would have been necessarily biased; indeed, we would have very certainly inserted questions about health. This is a striking example, because although the theme of “health” was proposed, it did not emerge in the analyses, and in the end very few people chose it… Were they in denial, or fed up? It is difficult to know, but what we did learn, thanks to our method, is that this subject was no longer part of the French people’s attention at that time. In addition to a theme proposed by the respondents and which we had not thought of – social networks and the transmission of information – the themes concerning the values of love, altruism, generosity, learning, etc. were the most chosen. These choices seem to contradict certain press articles – for example those mentioning the saturation of emergency numbers by denunciation calls (Kauffmann, Le Monde, April 10, 2020; Vidalie, L’Express, April 4, 2020; France Info, April 14, 2020; etc.). Those articles seem to suggest a health crisis leading to or accentuating a crisis of values. While there is perhaps a link, it does not in any case mean the press’ assumption is entirely right. In any case, reading these articles as well as many others could have encouraged us to carry out a survey on the basis of so-called “sensational” information, and we wanted to be totally free of any bias, which is what this method allows.

This is also why this method is so interesting: it can be used for other purposes. Let us take another example: in the age of telecommuting, how can we best support and help employees who are likely to have a hard time coping with the current situation? Of course, there are a plethora of diagnostic tools, but are these tools adapted when a company is not looking to “cure” its employees but to support them? It can thus start by enabling free, anonymous speech, by letting people express themselves on what they are experiencing, on the negative aspects of the situation but also on the positive ones. Once all the discourse has been gathered – anonymously of course – group work will allow us to create not only measurement tools, but also support tools, ideas, and applications. This work will also give meaning to an unprecedented situation, team cohesion, and acceptance of the tools thus created.
This method, which is based on two rigorously scientific methods (Churchill and Q methodology), allows the discourse to emerge freely, to be quantified, to be made “measurable”, but also to release the different thought structures in a fluid manner and without preconceived ideas, thus recreating meaning.
Churchill 2.0 has been tested on a large scale in the framework of the “Attention!” survey in order to measure and represent the attentional structures of the French. The results are currently being published.
Humans Matter now wishes to develop new use cases for this method by associating with actors in studies, trends, and consumer/user research in general.


